
By Fred Dews, Tamari Dzotsenidze
Brookings experts have taken a close look at the geography of poverty and prosperity both domestically and abroad. Below are some charts that illustrate this research.
Luminosity at night can be an indicator for poverty and economic growth
Jennifer Cohen, Raj Desai, and Homi Kharas from the Global Economy and Development program show how looking at the nighttime luminosity from satellite images of different regions within countries can help develop a forecast for sub-national poverty and economic growth. As luminosity increases, travel time, drought risk, and conflict-death rate decrease. In the chart below, luminosity data is a proxy for economic growth. Policymakers can use this geospatial data to target specific communities and improve outcomes for marginalized groups. (this research comes from the authors’ chapter in the new Brookings Press book, “Leave No One Behind: Time for Specifics on the Sustainable Development Goals.”)
Emerging e-commerce changes local job geography
With e-commerce continuing to grow while traditional retail dwindles, Adie Tomer and Joseph Kane from the Metropolitan Policy Program have studied the geographic implications of this shift in consumption, especially where e-commerce jobs are emerging. The loss of traditional retailers means a change in traffic patterns, job availability, and tax revenues, necessitating shifts in infrastructure and public transportation. Retail is often the biggest employer in metro areas, so local policymakers need to consider shifts toward e-commerce in future planning. “As a result,” Tomer and Kane write, “the geography of these establishments matters considerably for getting people to work, for moving goods, and for the source of local tax revenue.”
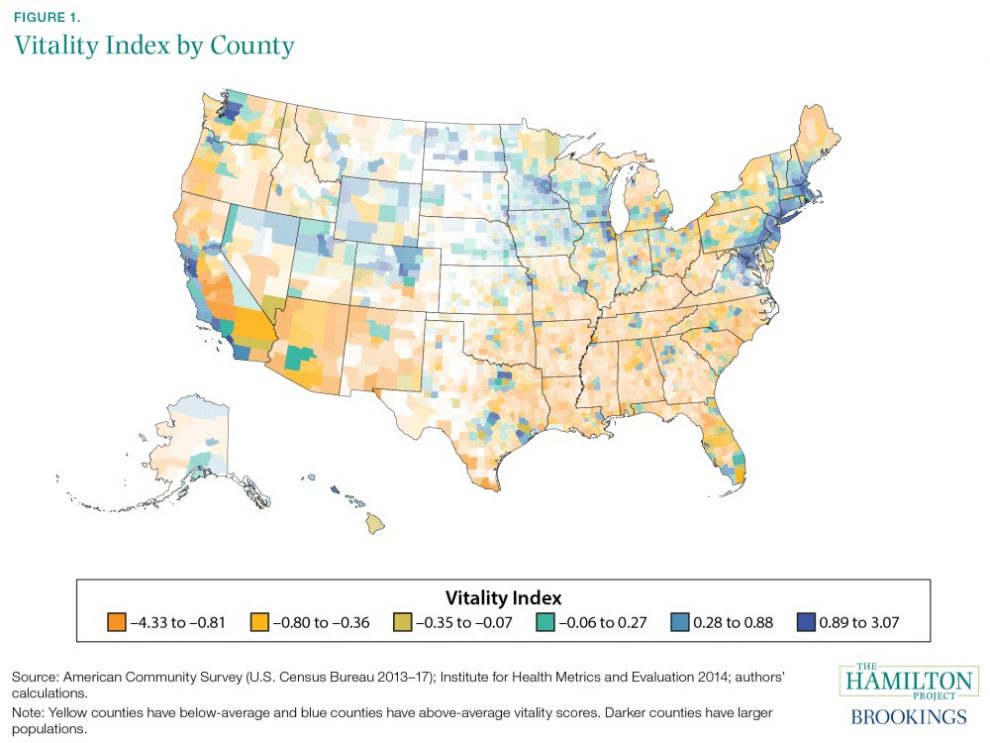
Explore the geography of domestic prosperity
The Hamilton Project’s Vitality Index is a measure of a place’s economic and social well-being. As the project explains, the index “combines a county’s median household income, poverty rate, unemployment rate, prime-age employment rate, life expectancy, and housing vacancy rate.” In the image below from the interactive graphic, the areas that have the highest vitality scores are in blue, while lower scores are in yellow.
Visit the Hamilton Project’s Vitality Index to take a closer look at individual states and counties.
This content was originally published here.
EL 2 DE JUNIO DEL 2024 VOTA PARA MANTENER
TU LIBERTAD, LA DEMOCRACIA Y EL RESPETO A LA CONSTITUCIÓN.

VOTA POR XÓCHITL